

Herro!
It’s been a while, but I’m still kicking. I got some new stuff to talk about. Specifically the binary instrumentation utility ‘PIN’ from Intel. We’re going to go over taking full advantage of this tool to cheat at games, unpack malwarez, and how to detect if your app is being run via PIN.
Part 1 of this series will be on detection of PIN.
For those who don’t know, the egg heads over at Intel have invented a binary instrumentation framework that allows for the manipulation of programs without source code. Remember detours? Same thing sort of, just cheaper (free), more documentation, and cross platform (Linux, Windows, ARM, android, etc).
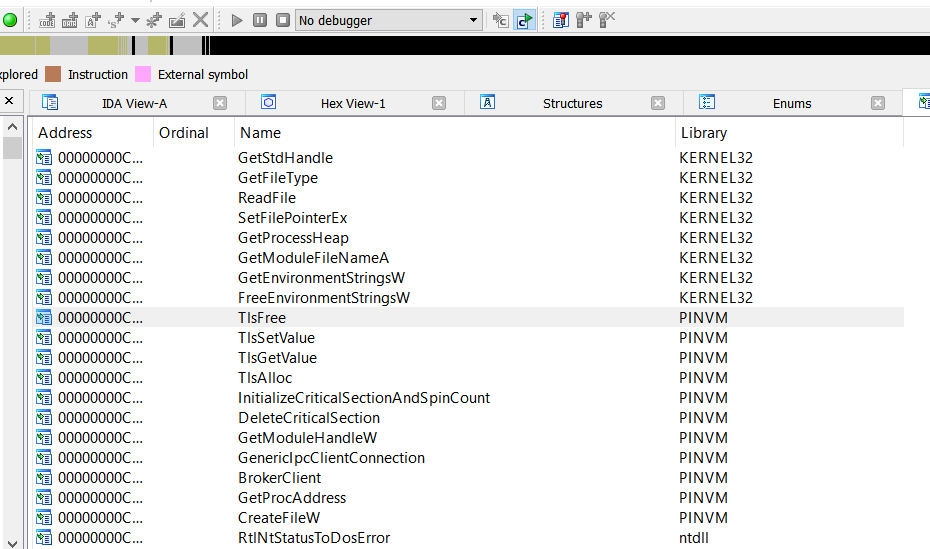
PIN allows me to monitor programs, break them, fix them without having source. I will cover more about this in my next sections. As I was playing with PIN, I was wondering to myself, “how could software detect the presence of PIN?”. After all, shared objects / dll’s import from something called ‘pinvm’.
 .
.
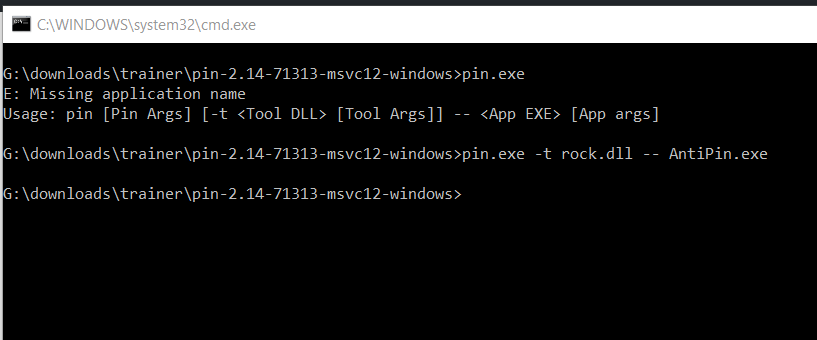
You run programs within PIN which then seems to launch as a child process.
Then it hit me – Enumerate the loaded modules for the pin module. Sounds simple enough right? Easy as hell with code:
        private void Form1_Load(object sender, EventArgs e)
        {
            Process Proc = Process.GetCurrentProcess();
            ProcessModuleCollection col = Proc.Modules;
            foreach (ProcessModule fuck in col)
            {
                tbf.Text += "Process Mod: " + fuck.ModuleName + "\r\n";
                if(fuck.ModuleName.Contains("pinvm"))
                {
                    MessageBox.Show("I see PIN!");
                }
            }

        }
Unfortunately, life is never simple. As we can see, we don’t get anything back when running PIN in tandem with our .net app:
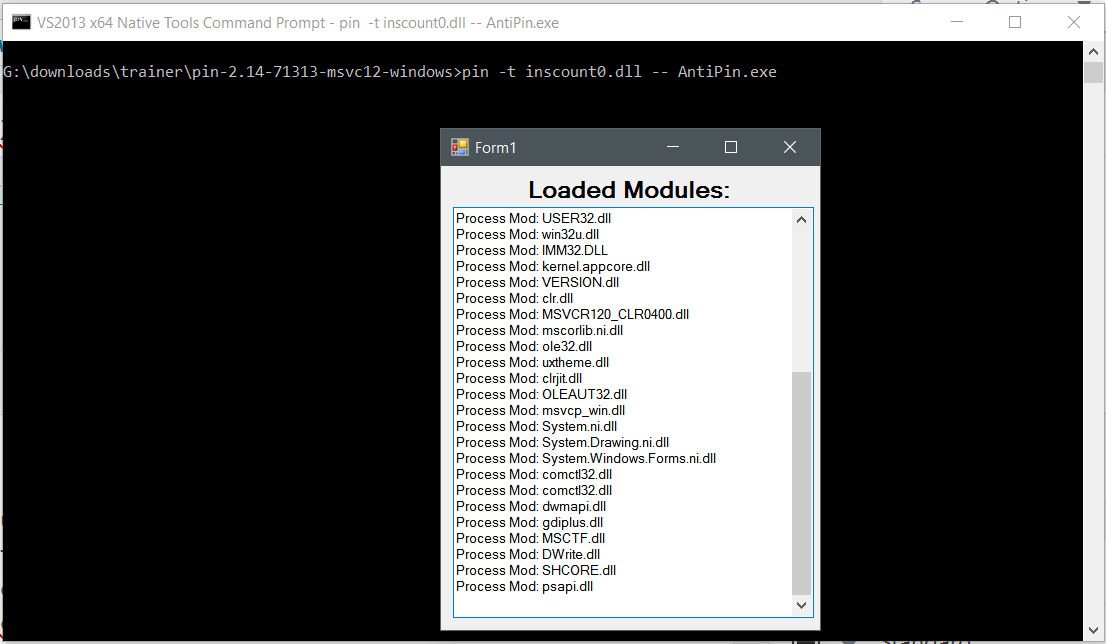
It’s missing the pinvm.dll module. Seems like it frees this module after loading.
I thought at first, maybe it’s a .net thing. Maybe I should try another way of enumerating process modules via the use of EnumProcessModules. Then I tried again with Module32First / Next. After that I said fuck it and enumerated the Process Environment Block’s LDR list. Again, no dice. Rather than clutter this blog post, I’ll just link the code here.
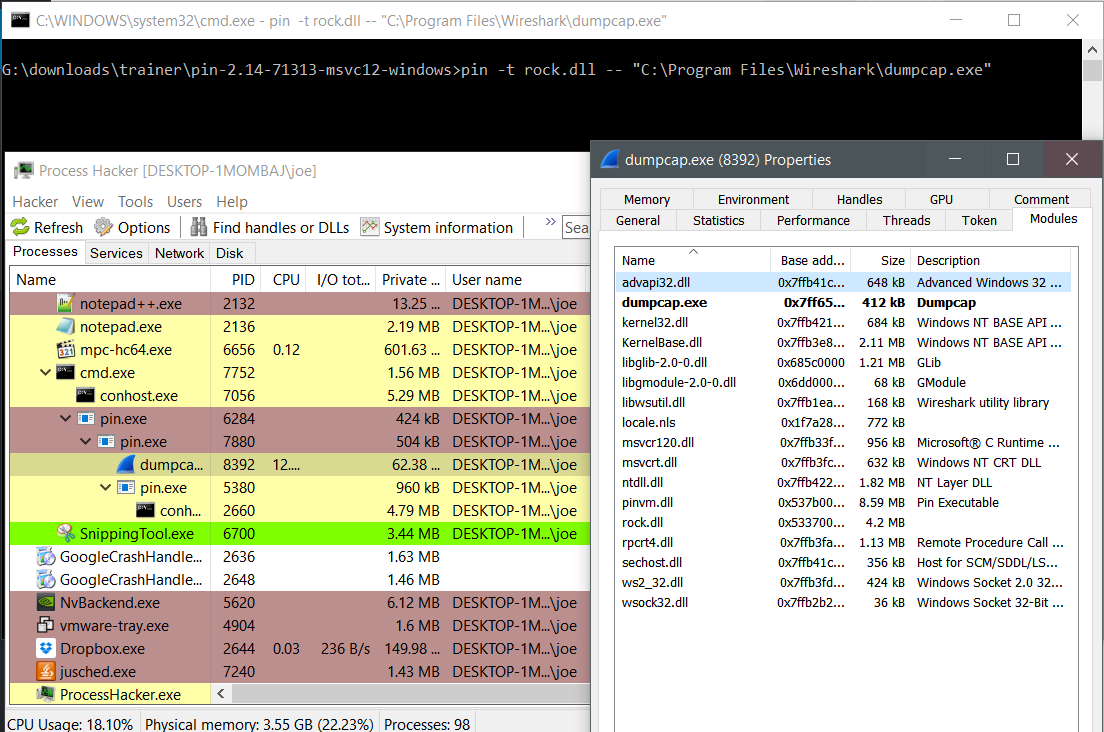
After some searching / head banging, I found exactly what I needed – a list of unloaded modules. Windows keeps track of all modules loaded and unloaded. It does this via the use of the API RtlGetUnloadEventTraceEx which is kind enough to store an array of structures that contain the modules we want. ProcessHacker has my back on this for example code, but it takes some serious hacking to get to work.
This is what i came up with (works with Visual Studio) for viewing unloaded modules.
#include <cstdio>
#include <vector>
#include <Windows.h>
#define 	PTR_ADD_OFFSET(Pointer, Offset)   ((PVOID)((ULONG_PTR)(Pointer) + (ULONG_PTR)(Offset)))

using pRtlGetUnloadEventTraceEx = void(NTAPI *)(_Out_ PULONG *ElementSize, _Out_
PULONG *ElementCount, _Out_ PVOID *EventTrace);
pRtlGetUnloadEventTraceEx RtlGetUnloadEventTraceEx = nullptr;

typedef struct _RTL_UNLOAD_EVENT_TRACE {
	PVOID BaseAddress;   // Base address of dll
	SIZE_T SizeOfImage;  // Size of image
	ULONG Sequence;      // Sequence number for this event
	ULONG TimeDateStamp; // Time and date of image
	ULONG CheckSum;      // Image checksum
	WCHAR ImageName[32]; // Image name
} RTL_UNLOAD_EVENT_TRACE, *PRTL_UNLOAD_EVENT_TRACE;

int main(int argc, char *argv[])
{
	HMODULE hModule = GetModuleHandle(L"ntdll.dll");
	RtlGetUnloadEventTraceEx =
		(pRtlGetUnloadEventTraceEx)GetProcAddress(hModule, "RtlGetUnloadEventTraceEx");
	if (RtlGetUnloadEventTraceEx == nullptr)
	{
		fprintf(stderr, "Could not retrieve RtlGetUnloadEventTraceEx. Error = %X\n",
			GetLastError());
		exit(-1);
	}
	NTSTATUS status;
	PULONG elementSize;
	PULONG elementCount;
	PVOID eventTrace;
	HANDLE processHandle = NULL;
	ULONG eventTraceSize;
	ULONG capturedElementSize;
	ULONG capturedElementCount;
	PVOID capturedEventTracePointer;
	PVOID capturedEventTrace = NULL;
	ULONG i;
	PVOID currentEvent;
	HWND lvHandle;
			RtlGetUnloadEventTraceEx(&elementSize, &elementCount, &eventTrace);
	OpenProcess((DWORD)&processHandle, PROCESS_VM_READ, GetCurrentProcessId());
	ReadProcessMemory(
		processHandle,
		elementSize,
		&capturedElementSize,
		sizeof(ULONG),
		NULL
		);
	ReadProcessMemory(
		processHandle,
		elementCount,
		&capturedElementCount,
		sizeof(ULONG),
		NULL
		);
	ReadProcessMemory(
		processHandle,
		eventTrace,
		&capturedEventTracePointer,
		sizeof(PVOID),
		NULL
		);
	if (!capturedEventTracePointer)
	{
		MessageBox(NULL, L"oops, no events", L"", 0);
	}
	if (capturedElementCount > 0x4000)
		capturedElementCount = 0x4000;

	eventTraceSize = capturedElementSize * capturedElementCount;
	capturedEventTrace = malloc(eventTraceSize);
	if (!capturedEventTrace)
	{
		MessageBox(NULL, L"oops, no events in trace", L"", 0);
	}
	ReadProcessMemory(
		processHandle,
		capturedEventTracePointer,
		capturedEventTrace,
		eventTraceSize,
		NULL
		);
	currentEvent = capturedEventTrace;

	for (i = 0; i < capturedElementCount; i++)
	{
		PRTL_UNLOAD_EVENT_TRACE rtlEvent = (PRTL_UNLOAD_EVENT_TRACE)currentEvent;
		INT lvItemIndex;
		WCHAR buffer[128];
		char * string;
		LARGE_INTEGER time;
		SYSTEMTIME systemTime;

		if (!rtlEvent->BaseAddress)
			break;

		fprintf(stdout, "Sequence: %u\r\n", rtlEvent->Sequence);
		fprintf(stdout, "Image Name: %s\r\n", rtlEvent->ImageName);
		fprintf(stdout, "Pointer: %x\r\n", rtlEvent->BaseAddress);
		fprintf(stdout, "Size of Image: %u\r\n", rtlEvent->SizeOfImage);
		fprintf(stdout, "Time stamp: %u\r\n", rtlEvent->TimeDateStamp);
		fprintf(stdout, "Checksum: %u\r\n", rtlEvent->CheckSum);

		currentEvent = PTR_ADD_OFFSET(currentEvent, capturedElementSize);
	}
	system("pause");
	return 0;
}
Process Hacker uses this code already when you look at loaded modules for applications running via PIN.
Now that we know how to detect PIN, we can prevent its use.
for (i = 0; i < capturedElementCount; i++)
	{
		PRTL_UNLOAD_EVENT_TRACE rtlEvent = (PRTL_UNLOAD_EVENT_TRACE)currentEvent;
		INT lvItemIndex;
		WCHAR buffer[128];
		char * string;
		LARGE_INTEGER time;
		SYSTEMTIME systemTime;

		if (!rtlEvent->BaseAddress)
			break;
		if(strcmp(rtlEvent->ImageName,"pinvm.dll"))
		{
		ExitProcess(1);
		}

		currentEvent = PTR_ADD_OFFSET(currentEvent, capturedElementSize);
	}
PIN is an awesome tool with a variety of uses, but for this first blog I thought I’d see how we could detect its usage. presently I have never seen malware or legitimate software check for the use of PIN, but we’ll see.
Stay tuned for part 2 when we dive into using PIN to watch memory, access function calls and arguments, and generally be really good for debugging. We’ll do some malware, I swear.
Until then, happy hacking!